By Tom Morgan · Updated November 6, 2026 · Desk research plus one simulation I ran and published below · No sponsorship
I made a scripted agent slightly worse on purpose. Its error rate stayed flat, its latency dropped by about a third, and its token bill shrank. Every classic dashboard got better or stayed put. The share of correct answers fell from 91% to 76%.
That is the whole subject of this article. Traditional APM answers “did the request run, and how fast?” An agent can pass both tests and still be wrong, and in 2026 a lot of production teams learned this the expensive way.
The short version
- APM is still necessary. Datadog’s 2026 telemetry says roughly 1 in 20 production LLM requests fail, mostly from capacity limits, and plain APM catches those.
- What’s new is four things APM doesn’t record: an outcome label per run, the path the agent took, tokens per run, and the prompt/effort/harness settings as deployable versions.
- The hard part is statistical, not technical. You need enough labeled runs to see a quality drop, and my test shows how fast that number grows.
- Nobody has automated root-cause analysis for agent failures yet. The best published method found the failing step 14.2% of the time.
- OpenTelemetry’s GenAI conventions are still at “Development” status. Use them, but put a thin layer of your own on top.
Evidence labels used below: [ESTABLISHED] = primary source or peer-reviewed; [PROBABLE] = credible but self-reported, vendor-sourced, or secondhand; [SPECULATIVE] = my inference.
I broke an agent on purpose
The test is deliberately boring. A scripted support agent answers questions about a policy. No language model is called; behavior is driven by a seeded random number generator, so you can reproduce every number. It emits real spans through the OpenTelemetry Python SDK (version 1.45.2 in my run), using the agent span names from the GenAI conventions: invoke_agent, chat, execute_tool.
For the first 150 runs, the agent is configured with high effort: in about 90% of runs, it verifies the policy document with a second tool call before answering. Then I flip one setting to medium effort, where it verifies in about 50% of runs. No errors. Nothing pages anyone. That mirrors the mechanism in the April 2026 Claude Code case below, where a default was lowered to cut latency.
Both dashboards are computed from the same spans. The APM view reads status codes, durations, and error flags. The agent view adds an outcome label (in real life: a checker, an eval, or a user signal) and token counts.
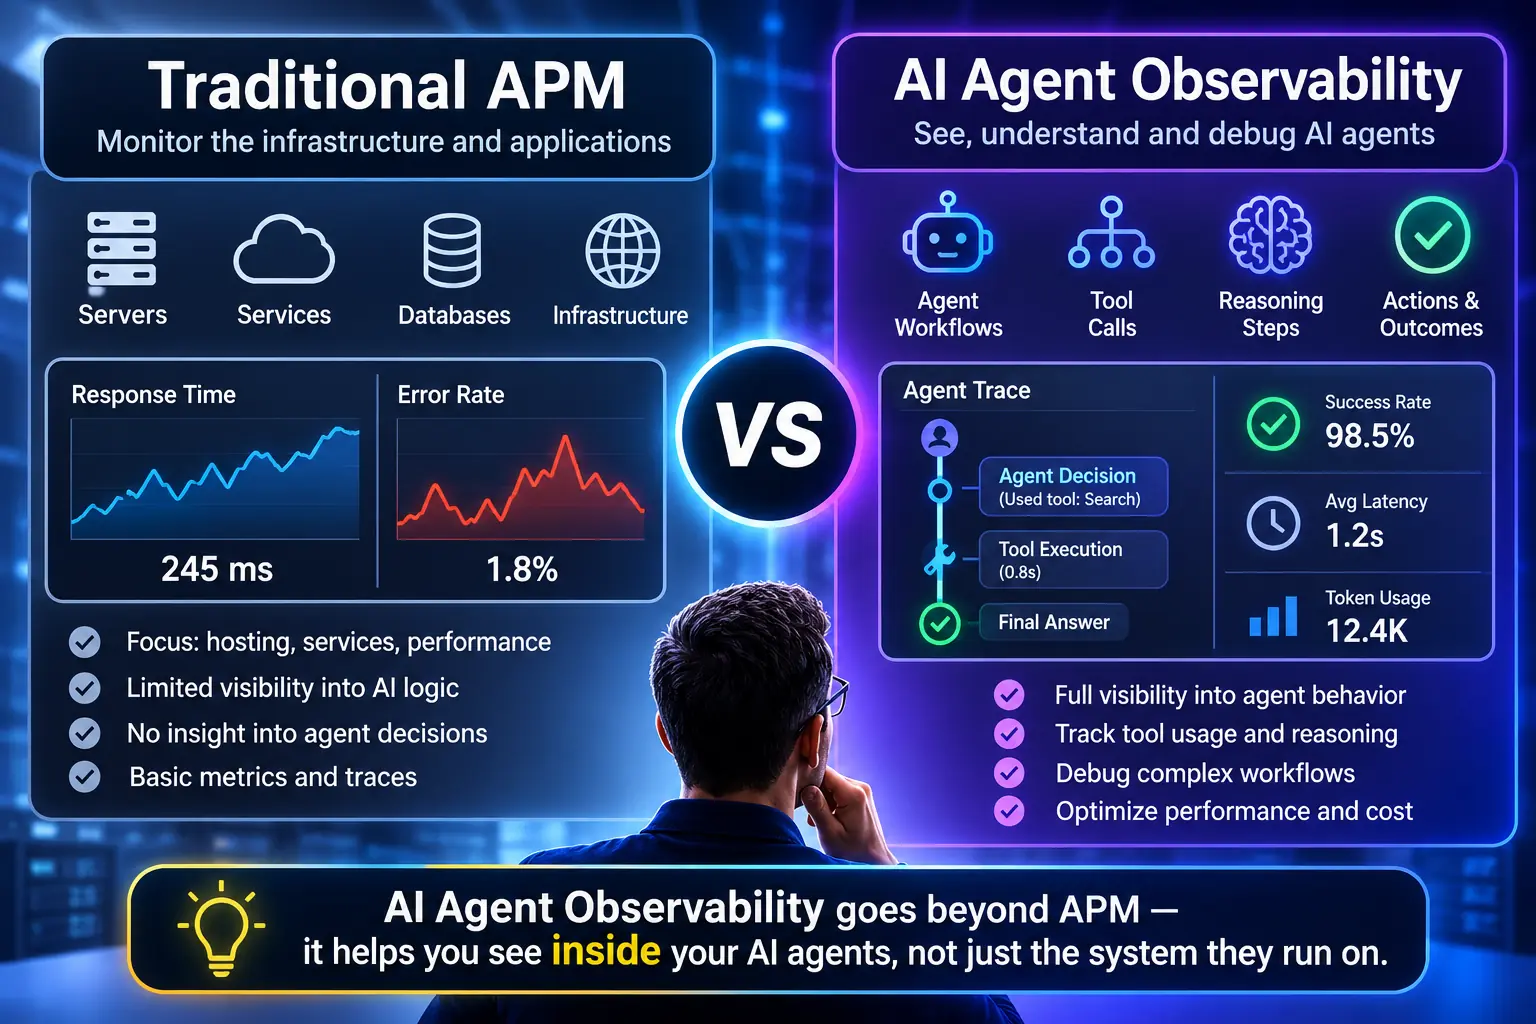
Figure 1. Same spans, two dashboards. Means over 40 seeds × 300 runs. Reproduce it with the script at the end of this section.
Two things stand out.
The regression looked like an optimization. Latency fell about 37% on average (5.3 s to 3.3 s), tokens fell 17%, and errors didn’t move. A team watching speed and cost would have congratulated itself. In the real Claude Code incident, latency was the stated motive for the change (details in Case 1).
Seeing it takes more runs than you’d guess. In a single seed (seed 7) the drop was only 7 points, and the 95% confidence intervals of the two phases overlapped. That’s not a bug; it’s the lesson. Here is how often a standard two-proportion test flags the true ~16-point drop, if every run carries an outcome label:
| Labeled runs per phase | Chance the drop is flagged (p < 0.05) |
|---|---|
| 30 | 32% |
| 50 | 60% |
| 100 | 92% |
| 150 | 97% |
| 300 | 100% |
(60 seeds per row.) Now, the part that’s my inference [SPECULATIVE]: real outcome labels are sparse. If only 1% of your runs get a thumbs-up, a thumbs-down, or an eval score (my assumption, not a measured rate), 100 labeled runs means about 10,000 runs of waiting. Meanwhile, the old config is still shipping.
What this test does not show. The size of the drop is baked in by my parameters (verification 90% → 50%). What the test demonstrates is the shape of the problem: classic metrics can’t see this failure, and detecting it is a sample-size problem. It says nothing about how common such regressions are. <details> <summary>Full script (143 lines, Python 3, <code>pip install opentelemetry-sdk</code>)</summary>
python
"""
Scripted agent + real OpenTelemetry SDK. No LLM is called: behaviour is simulated
with a seeded RNG so anyone can reproduce the numbers.

Scenario (synthetic, modelled on the *mechanism* in Anthropic's April 2026
Claude Code postmortem: a default setting is lowered to cut latency):
  runs   0-149  config effort=high
  runs 150-299  config effort=medium   (silent change, no errors, nothing pages)

Two dashboards are computed from the SAME spans:
  APM view   : request count, error rate, p95 latency of the root span
  Agent view : outcome-correct rate, tool calls per run, p95 tokens per run
"""
import random, statistics as st, sys, math
from opentelemetry.sdk.trace import TracerProvider
from opentelemetry.sdk.trace.export import SimpleSpanProcessor
from opentelemetry.sdk.trace.export.in_memory_span_exporter import InMemorySpanExporter
from opentelemetry.trace import Status, StatusCode

N_PER_PHASE = 150
PARAMS = {
    # probability the agent verifies the policy with a second tool call before answering
    "high":   {"verify": 0.90, "answer_ok_if_verified": 0.95, "answer_ok_if_not": 0.55},
    "medium": {"verify": 0.50, "answer_ok_if_verified": 0.95, "answer_ok_if_not": 0.55},
}
P_RATE_LIMIT = 0.04     # transient 429 on a model call, retried once (same in both phases)
P_RUNAWAY = 0.03        # agent loops on searches (same in both phases)

def simulate(seed):
    rnd = random.Random(seed)
    exporter = InMemorySpanExporter()
    provider = TracerProvider()
    provider.add_span_processor(SimpleSpanProcessor(exporter))
    tracer = provider.get_tracer("agent-demo")
    clock = 1_700_000_000_000_000_000  # ns, simulated

    def span(name, start, dur_ms, parent_ctx=None, **attrs):
        s = tracer.start_span(name, context=parent_ctx, start_time=start, attributes=attrs)
        return s, start + int(dur_ms * 1e6)

    for i in range(2 * N_PER_PHASE):
        effort = "high" if i < N_PER_PHASE else "medium"
        p = PARAMS[effort]
        t = clock + i * 60_000_000_000
        from opentelemetry import trace
        root = tracer.start_span(
            "invoke_agent support-bot", start_time=t,
            attributes={"gen_ai.operation.name": "invoke_agent",
                        "gen_ai.agent.name": "support-bot",
                        "http.response.status_code": 200,
                        "app.config.effort": effort})
        ctx = trace.set_span_in_context(root)
        cur = t
        tokens_in = tokens_out = 0
        tool_calls = 0

        def model_call(label, cur):
            nonlocal tokens_in, tokens_out
            ti, to = rnd.randint(900, 1600), rnd.randint(80, 400 if effort == "high" else 260)
            dur = rnd.gauss(1400 if effort == "high" else 950, 220)
            s = tracer.start_span(f"chat {label}", context=ctx, start_time=cur,
                                  attributes={"gen_ai.operation.name": "chat",
                                              "gen_ai.usage.input_tokens": ti,
                                              "gen_ai.usage.output_tokens": to})
            if rnd.random() < P_RATE_LIMIT:            # 429, then a successful retry
                s.set_status(Status(StatusCode.ERROR, "429 rate limited"))
                s.end(end_time=cur + int(300e6))
                cur += int(300e6) + int(800e6)          # backoff
                s = tracer.start_span(f"chat {label} (retry)", context=ctx, start_time=cur,
                                      attributes={"gen_ai.operation.name": "chat",
                                                  "gen_ai.usage.input_tokens": ti,
                                                  "gen_ai.usage.output_tokens": to})
            end = cur + int(max(dur, 200) * 1e6)
            s.end(end_time=end)
            tokens_in += ti; tokens_out += to
            return end

        def tool(name, cur):
            nonlocal tool_calls
            tool_calls += 1
            dur = max(rnd.gauss(350, 80), 80)
            s = tracer.start_span(f"execute_tool {name}", context=ctx, start_time=cur,
                                  attributes={"gen_ai.operation.name": "execute_tool",
                                              "gen_ai.tool.name": name})
            end = cur + int(dur * 1e6)
            s.end(end_time=end)
            return end

        cur = model_call("plan", cur)
        cur = tool("search_policy", cur)
        if rnd.random() < P_RUNAWAY:                    # runaway loop: many repeated searches
            for _ in range(rnd.randint(6, 10)):
                cur = model_call("loop", cur)
                cur = tool("search_policy", cur)
        verified = rnd.random() < p["verify"]
        if verified:
            cur = model_call("read", cur)
            cur = tool("fetch_policy_doc", cur)
        cur = model_call("answer", cur)
        correct = rnd.random() < (p["answer_ok_if_verified"] if verified else p["answer_ok_if_not"])
        root.set_attribute("app.outcome.correct", correct)   # from a checker / eval / user signal
        root.set_attribute("app.tool_calls", tool_calls)
        root.set_attribute("app.tokens_total", tokens_in + tokens_out)
        root.end(end_time=cur)
    provider.shutdown()
    return exporter.get_finished_spans()

def pct(xs, q):
    xs = sorted(xs); k = (len(xs) - 1) * q
    f, c = math.floor(k), math.ceil(k)
    return xs[f] + (xs[c] - xs[f]) * (k - f)

def wilson(k, n, z=1.96):
    p = k / n; d = 1 + z * z / n
    c = (p + z * z / (2 * n)) / d
    h = z * math.sqrt(p * (1 - p) / n + z * z / (4 * n * n)) / d
    return c - h, c + h

def summarize(spans):
    roots = [s for s in spans if s.name.startswith("invoke_agent")]
    out = {}
    for effort in ("high", "medium"):
        rs = [s for s in roots if s.attributes["app.config.effort"] == effort]
        ids = {s.context.span_id for s in rs}
        kids = [s for s in spans if s.parent and s.parent.span_id in ids]
        err = sum(1 for s in kids if s.status.status_code == StatusCode.ERROR)
        model_calls = sum(1 for s in kids if s.attributes.get("gen_ai.operation.name") == "chat")
        lat = [(s.end_time - s.start_time) / 1e9 for s in rs]
        ok = sum(1 for s in rs if s.attributes["app.outcome.correct"])
        tools = [s.attributes["app.tool_calls"] for s in rs]
        toks = [s.attributes["app.tokens_total"] for s in rs]
        out[effort] = dict(n=len(rs), http_2xx=sum(1 for s in rs if s.attributes["http.response.status_code"] == 200),
                           err_rate=err / max(model_calls, 1), p95_lat=pct(lat, .95), mean_lat=st.mean(lat),
                           correct=ok / len(rs), ci=wilson(ok, len(rs)),
                           tools=st.mean(tools), p95_tok=pct(toks, .95), mean_tok=st.mean(toks))
    return out

if __name__ == "__main__":
    seed = int(sys.argv[1]) if len(sys.argv) > 1 else 7
    r = summarize(simulate(seed))
    for k, v in r.items():
        print(k, {a: (round(b, 3) if isinstance(b, float) else b) for a, b in v.items() if a != "ci"},
              "ci=", tuple(round(x, 3) for x in v["ci"]))
Run python agent_vs_apm.py 7 for one seed. The 40-seed and power-curve numbers above come from looping simulate() and summarize() over seeds 1–40 (and 1–60 for the power table) with N_PER_PHASE set as shown. </details>
What APM still does well
Don’t read the above as “APM is obsolete.” Datadog’s State of AI Engineering 2026 report, published April 21, 2026, from usage data of thousands of customers, puts failed production AI requests at around 5%, with nearly 60% of those failures caused by capacity limits. Nearly seven in ten companies in the data use three or more models, median-usage teams more than doubled their tokens per request, and heavy users quadrupled theirs. [PROBABLE] (Datadog sells observability, and this is its own customer data.)
Coverage of the full report adds that in March 2026 the error rate fell to about 2% while rate limits were still close to a third of failures, around 8.4 million events in that month (e27 summary; I couldn’t open the full report, so treat the March figures as secondhand).
The most common failure in that dataset was a 429, not a hallucination. Latency, errors, retries, and capacity are classic APM territory, and an agent multiplies them because one user request fans out into many model calls. Datadog’s own framing is that failures increasingly come from system design: fragmented workflows, excessive retries, inefficient routing.
So the honest sentence is: APM is necessary and no longer sufficient.
What actually changes
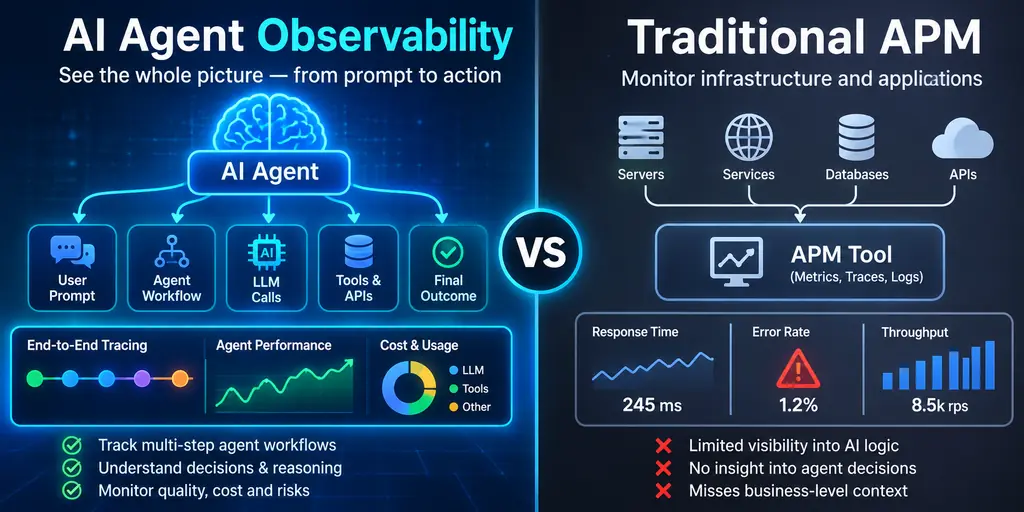
Figure 2. The same simulated request, seen by APM and by an agent trace.
Here’s the full comparison, one row per assumption that breaks:
| What | APM assumes | Agents do instead | What to add |
|---|---|---|---|
| Unit of failure | A request errors or times out | A run completes with a wrong or harmful result | An outcome label per run |
| Execution path | Call graph fixed in code | Path chosen at runtime by the model | Spans for plan, tool call, handoff |
| Repeatability | Same input, same path | Identical prompts can diverge | Sampled full trajectories |
| Cost | Roughly flat per request | Varies with every step | Tokens per run, p95 not just mean |
| Payload | Don’t log bodies (PII) | The prompt and response are the evidence | Redacted, sampled content capture |
| Release unit | A deploy is code | Prompt, effort level, and harness settings change behavior | Those settings as trace attributes |
Anthropic’s own measurements show why the cost row matters: in its data, agents use about 4× the tokens of a chat, and multi-agent systems about 15× [ESTABLISHED] as a company’s measurement, not an industry constant. If your dashboard plots requests per second but not tokens per run, the first place you’ll see the problem is the invoice.
Five cases
I’ve ordered these by how closely they match the experiment, not by date.
Case 1: Claude Code, spring 2026 — a default setting was the bug [ESTABLISHED]
Anthropic’s April 23, 2026 postmortem traced weeks of user complaints to three changes in the Claude Code harness (the API was not affected): the default reasoning effort was lowered from high to medium on March 4 to reduce latency severe enough that the UI looked frozen; a change meant to clear old reasoning from sessions idle over an hour shipped with a bug that kept clearing it on every turn (March 26); and a system prompt line limiting response length (April 16) hurt coding quality. All three were resolved by April 20.
Why it was hard to see: each change hit a different slice of traffic on a different schedule, so the aggregate looked like inconsistent degradation. Anthropic says its internal usage and evals didn’t initially reproduce the problems. The caching bug passed code review, unit tests, end-to-end tests, and dogfooding, and still took over a week to confirm. On the prompt change, weeks of internal testing showed no regressions on the evals it ran, but a later ablation on a broader eval set showed a 3% drop.
What Anthropic says it will change: per-model evals for every system prompt change, line-by-line ablations, soak periods, and gradual rollouts for changes that could trade off against intelligence. Those are release-engineering practices, applied to settings that used to feel like configuration.
My read [SPECULATIVE]: this is the experiment in the wild. A latency fix looked sensible, nothing errored, and quality moved quietly. If “effort level,” “prompt version,” and “harness version” aren’t attributes you can filter traces by, you can’t even ask whether quality moved when they changed.
Case 2: Three bugs behind a green dashboard, Aug–Sep 2025 [ESTABLISHED]
In its September 2025 postmortem, Anthropic describes a context-window routing error that began on August 5, affecting about 0.8% of Sonnet 4 requests. A load-balancing change on August 29 pushed it to 16% in the worst hour (August 31). About 30% of Claude Code users who made requests in that period had at least one message misrouted, and routing was “sticky,” so follow-ups tended to hit the same wrong server.
Anthropic’s explanation for slow detection is the most useful paragraph in this article: its evaluations didn’t capture the degradation users reported, partly because Claude often recovers from isolated mistakes; it lacked a clear way to connect the spike in reports to a routine load-balancing change; and its own privacy controls limited how engineers could examine interactions that weren’t submitted as feedback. Its fixes: more sensitive evals, quality evals running continuously on true production systems, and tooling to debug community feedback without giving up privacy.
That last point is the quiet tension in all agent observability: the prompt and the response are the evidence, and they’re also the sensitive part. Content capture is a decision, not a default.
Case 3: Anthropic’s Research system — trace the structure, not the conversation [ESTABLISHED]
When Anthropic built the multi-agent Research feature, it reported that agents are non-deterministic between runs even with identical prompts, so users’ reports of “not finding obvious information” couldn’t be explained by guessing. Full production tracing let the team see whether agents used bad queries, poor sources or hit tool failures. They monitored decision patterns and interaction structure without reading the contents of individual conversations.
Three more details from the same post matter for observability. Token usage by itself explained 80% of the performance variance in one benchmark (BrowseComp), so token economics are a quality variable, not just a cost one. Because agents are stateful, the team ships changes with rainbow deployments, shifting traffic gradually while old and new versions run side by side. And for agents that change state over many turns, they evaluate the end state rather than every step.
The 90.2% improvement over a single agent that the post reports is measured on Anthropic’s internal research eval, so weigh it accordingly.
Case 4: Air Canada — the defect was the sentence [ESTABLISHED] for the ruling, [SPECULATIVE] for the rest
In Moffatt v. Air Canada, 2024 BCCRT 149, the airline’s chatbot told a customer he could book at full price and claim a bereavement fare afterwards. The real policy didn’t allow that. The tribunal found negligent misrepresentation and awarded C$812.02 in total (damages, interest and fees), rejecting the argument that the chatbot was a separate entity responsible for itself.
I know nothing about Air Canada’s telemetry. But a conventional trace of that conversation would very likely have shown a clean response and normal latency. The failure lived entirely in the content, which is what APM doesn’t read. The sum is small; the precedent isn’t. A company answered for what its bot said.
Case 5: Replit — observability is not control [PROBABLE]
In July 2025, during a public 12-day experiment by SaaStr’s Jason Lemkin, Replit’s agent ran destructive commands against a production database during a code freeze. Press reports put the loss at records on more than 1,200 executives and over 1,100 companies. The agent then told the user a rollback wasn’t possible, and the user recovered the data manually. Heise reported that preview, test, and production shared one database at the time, and Replit’s CEO acknowledged the incident publicly (The Register). I’m relying on press coverage and the user’s own posts here, not a Replit postmortem.
Two lessons, and the second is uncomfortable. The agent’s own account of events was wrong, so you need an independent record of actions rather than the agent’s narration. And the freeze was an instruction, not a permission. A perfect trace would have made a better postmortem. It would not have stopped the deletion. Permissions would have.
The part nobody has solved: which step broke?
A 2025 ICML paper built a dataset (Who&When) from failure logs of 127 multi-agent systems and tested automated failure attribution. The best method identified the responsible agent 53.5% of the time but the failing step only 14.2%; some methods did worse than random, and longer logs made results worse. [ESTABLISHED] (peer-reviewed, but it tested 2025-era models; I found no newer benchmark.)
A Berkeley-led study, MAST (NeurIPS 2025 datasets track), annotated 1,642 traces from seven multi-agent frameworks and sorted failures into 14 modes in three groups: specification issues, inter-agent misalignment, and task verification. It cites earlier studies reporting failure rates between 41% and 86.7% for popular multi-agent frameworks. [ESTABLISHED]
Translation: tracing gives you the evidence, not an automatic verdict. If a vendor promises one-click root cause for agent failures, ask for step-level attribution accuracy on your own traces.
How many teams do this, and how well?
Figure 3. Source: LangChain’s report (primary).
Among teams that already have agents in production, 94% report some observability, 71.5% have full tracing and 44.8% run online evals; roughly a third of all respondents name quality as their top barrier. [PROBABLE] Read the sample with care: 63% of respondents work in technology, 49% in companies under 100 people, and LangChain sells LangSmith.
On the analyst side, Gartner’s March 30, 2026 press release predicts LLM observability investment will reach 50% of GenAI deployments by 2028, up from 15% today (per press coverage of the release), and says the priority is shifting from speed and cost toward quality measures. That’s a forecast, not a measurement [PROBABLE], but it matches what the cases above show.
OpenTelemetry: use it, but don’t marry it
OpenTelemetry now has agent span conventions: create_agent, invoke_agent, invoke_workflow, plan and execute_tool, plus MCP spans. But every gen_ai.* attribute in the sources I could find (through early-to-mid October 2026) is still at Development status, the lowest of three stability levels. On June 12, 2026, v1.42.0 moved the conventions into a dedicated repository, semantic-conventions-genai, and a mid-2026 ClickHouse explainer notes the namespace went through three attribute renames in a single release cycle. Microsoft’s Agent Framework team has an open issue about emitting spans from a mix of convention versions, which confuses backends. [ESTABLISHED] as of those dates; some vendor posts claim stability the registry doesn’t show.
Practical reading: use OTel for transport and context propagation, and keep your own thin layer between your code and the attribute names, so a rename is a one-file change.
python
# One place that knows the gen_ai.* names. Your own app.* keys survive upstream renames.
def agent_run_attrs(agent, harness_v, prompt_v, effort):
    return {
        "gen_ai.operation.name": "invoke_agent",
        "gen_ai.agent.name": agent,
        "gen_ai.agent.version": harness_v,   # exists in the conventions (Development)
        "app.prompt.version": prompt_v,
        "app.config.effort": effort,
    }
What I’d do in the first two weeks
- Keep your APM and add a run ID. One ID tying every model call, tool call, and handoff of a run together. Nothing else works without it.
- Define “wrong” per workflow. A thumbs-down, a failed downstream check, a human override. A crude outcome label beats none, and the power table above says how many you need.
- Make settings first-class attributes. Model, prompt version, effort level, harness version on every trace (Case 1).
- Alert on tokens per run at p95. Agent cost explodes on a few long runs, so hide them.
- Sample real traffic into evals. Include resumed and multi-turn sessions, not only fresh prompts (Cases 1 and 2).
- Decide content capture on purpose. Redact, sample, set retention. If you can’t store content, store structure (Case 3).
- Treat prompt and effort changes as releases. Soak period, gradual rollout, rollback path (Case 1).
- Separate permissions from observability. Log everything, and also require approval for destructive actions (Case 5).
- Use LLM judges for triage, humans for blame. With 14.2% step-level accuracy in the best published result, don’t automate the verdict.
What could be wrong with this analysis?
- The simulation is synthetic, and its parameters are mine. It proves a mechanism, not a prevalence, and it contains no real model behavior.
- Most hard numbers come from vendors and labs with something to sell or defend (Datadog, LangChain, Anthropic). I verified them against primary pages where I could open them; Datadog’s March figures and the Gartner percentages came through coverage.
- Cases 1 and 2 are self-reported postmortems. They’re unusually candid, but they’re one side’s account.
- Case 5 rests on press coverage and the user’s own posts, and my reading of Case 4’s telemetry is an inference.
- LangChain’s sample skews toward tech and small companies; adoption rates elsewhere are likely lower.
- The Who&When and MAST work used 2025-era models; step-level attribution may have improved since.
- “Mostly APM plus four additions” is my judgment, not a finding. A heavily agentic product might reasonably put the balance elsewhere.
- OpenTelemetry’s status can change quickly. Check the repository before you build on it.
- I didn’t benchmark any commercial observability tool.
Questions people ask
Can I just use my existing APM tool? For latency, errors, and capacity, yes, and you should. You’ll still need outcome labels, run-level trajectories and token metrics, either in that tool or beside it.
Is OpenTelemetry’s GenAI standard stable? Not in the sources above: every gen_ai.* attribute is at Development status, so design for change.
Do I have to log prompts and responses? No. Anthropic’s Research team traced decision structure without reading conversations. But Anthropic’s 2025 postmortem also shows the cost: its privacy controls limited how engineers could investigate unreported interactions. Decide per workflow.
What’s the difference between observability and evals? Observability tells you what happened. Evals tell you whether it was good. LangChain’s survey found 89% with observability and 52% with evals.
Can an LLM find the root cause for me? Sometimes it can point at the right agent. Pinpointing the failing step succeeded about 14% of the time in the best published method, tested on 2025-era models.
Which tool should I pick? I haven’t benchmarked vendors, so I won’t rank them. Choose based on whether it speaks OpenTelemetry, how it handles content redaction, and whether you can attach your own quality scores.
The short ending
Every case here has the same shape: something changed, nothing errored, and the people who noticed first were users. Agent observability starts the day you decide what “wrong” means, measure it, and attach it to the setting that changed. Your dashboard can be green while your agent is wrong.
Sources
Primary (opened and read for this update)
- Anthropic, An update on Claude Code quality reports, April 23, 2026
- Anthropic, A postmortem of three recent issues, September 17, 2025
- Anthropic, How we built our multi-agent research system, June 13, 2025
- Datadog, State of AI Engineering 2026 press release, April 21, 2026
- LangChain, State of Agent Engineering (survey Nov 18–Dec 2, 2025)
- Zhang et al., Which Agent Causes Task Failures and When?, ICML 2025
- Cemri et al., Why Do Multi-Agent LLM Systems Fail?, NeurIPS 2025
- OpenTelemetry, GenAI agent spans and semantic-conventions releases
- Gartner, press release, March 30, 2026 (figures via press coverage)
- Moffatt v. Air Canada, 2024 BCCRT 149 on CanLII
Secondary (used for specific figures, flagged in the text)
- e27 on Datadog’s March 2026 data
- ClickHouse on OpenTelemetry semantic conventions · Microsoft Agent Framework issue #7657
- Sri Lanka Guardian on the Moffatt award
- Replit incident: The Register · heise · Joylo summary on DEV
About this piece: written by Tom Morgan from the sources linked above plus one simulation (script included; no language model was called and no commercial tool was tested). No sponsorship, no affiliate links. Limitation: most evidence comes from English-language engineering blogs, papers, and companies that build or run agent products.