
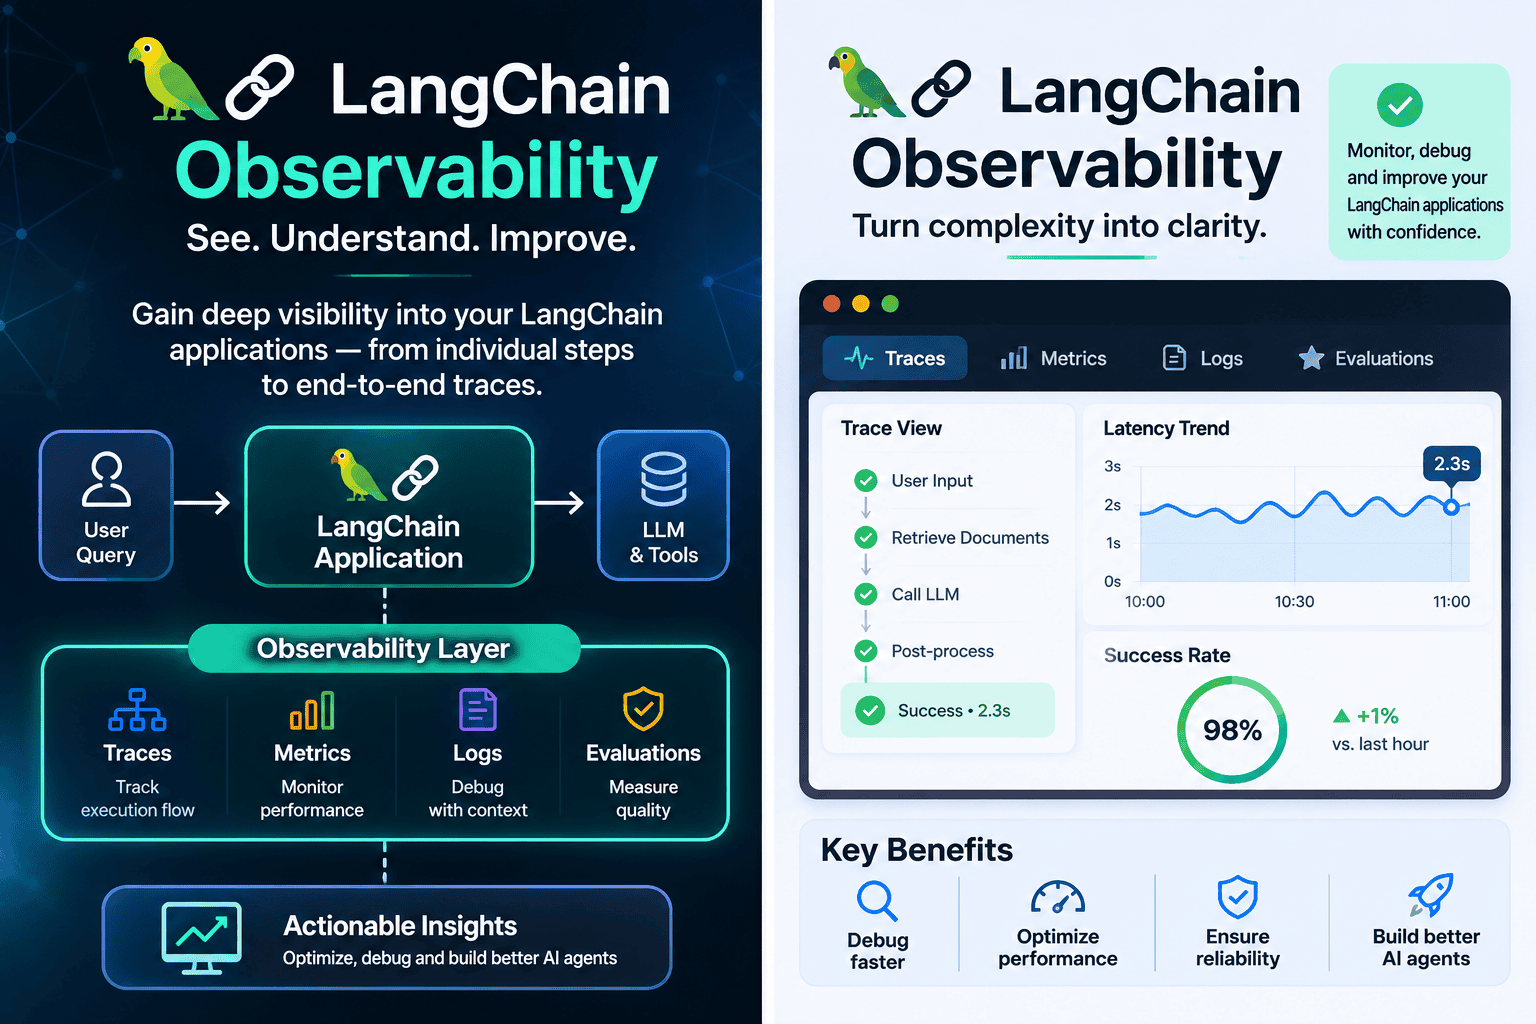
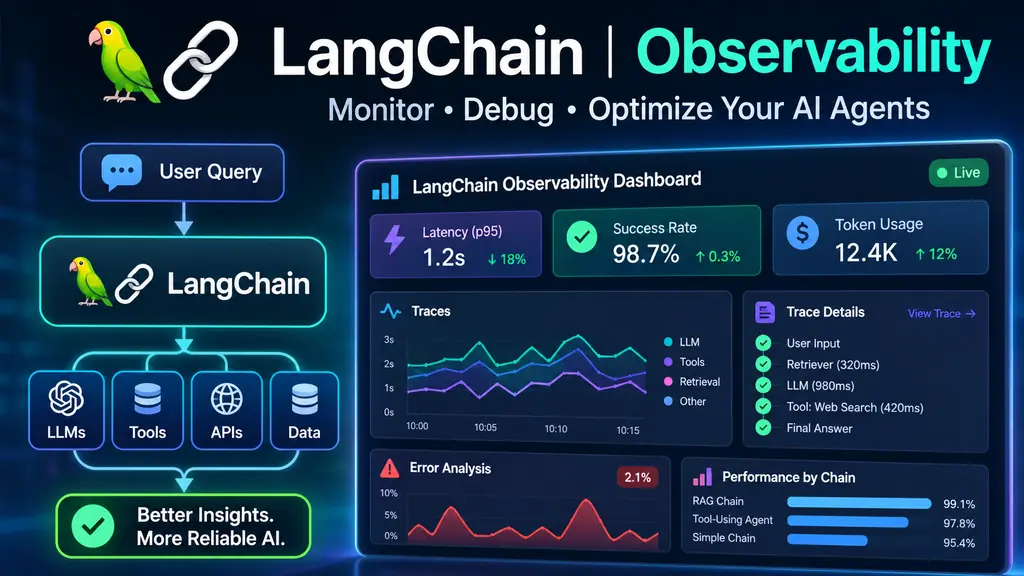
Short answer. For a LangChain or LangGraph app, turning on LangSmith tracing takes two environment variables and no code changes. The setup is the easy 10%. The other 90% is deciding what to capture, how long to keep it, what leaves your servers, and what the invoice will look like.
Here is the part most guides get wrong right now: an additional base trace costs $5 per 1,000 on the current plan, not the $0.50 or $2.50 that many 2026 articles still print. A Plus seat with 100,000 traces a month lands near $489, before evaluators or extended retention.
Last verified: 2 November 2026 against LangChain’s official pricing page and documentation. Pricing in this space changes quickly, so check the date before you budget.
In this guide
- The 10-minute setup (LangChain, LangGraph, OpenTelemetry)
- What a trace is, and what you are billed for
- The 2026 price, and why sources disagree
- A cost script you can copy
- The retention traps that inflate the bill
- Sampling and conditional tracing, tested
- Production gotchas
- LangSmith vs Langfuse vs OpenTelemetry
- Three teams that used tracing in production
- Checklist, FAQ and sources
How this was researched
- Pricing and retention come from LangChain’s official pricing page, fetched on 2 November 2026, and its documentation. Where the official page does not print a number, I say so and name the secondary source I used instead.
- Code and behaviour claims in the sampling section were executed, not just copied from docs. I ran the LangSmith SDK, LangChain Core and LangGraph against a local capture server and counted what the client sent. The test script is in the appendix so you can rerun it.
- What I did not do: I did not run a paid LangSmith account, so nothing here measures server-side billing, UI behaviour or real production traffic. Those claims rest on the docs and on named third-party write-ups.
- A disclosure: one of the most detailed pricing guides I used (ZenML) is published by a company that sells a competing evaluation tool. I used it for mechanics that also match LangChain’s own page, and I flag where it is the only source.
Tested versions: Python 3.12.3, langsmith 0.14.17, langchain-core 1.7.3, langgraph 1.2.19.
The 10-minute setup
LangChain’s docs say that if you build with LangChain or LangGraph, tracing turns on with environment variables alone (Trace with LangGraph).
bash
pip install -U langchain-core langgraph langsmith

export LANGSMITH_TRACING=true
export LANGSMITH_API_KEY="<your-langsmith-api-key>"
export LANGSMITH_PROJECT=my-agent-project   # optional; otherwise a default project is created
export OPENAI_API_KEY="<your-provider-key>" # or whichever model provider you use
Run your chain or agent as usual. In LangSmith, open Tracing, pick your project and click a row. That is the whole trick for LangChain code. For code that does not use LangChain, the observability quickstart shows the @traceable wrapper.
A LangGraph example (executed)
This minimal graph has no model call, so you can run it anywhere. It loops 30 times, which makes it a good test of the billing question later.
python
from typing import TypedDict
from langgraph.graph import StateGraph, START, END

class S(TypedDict):
    n: int

def step(s: S) -> dict:
    return {"n": s["n"] + 1}

def route(s: S):
    return "step" if s["n"] < 30 else END

g = StateGraph(S)
g.add_node("step", step)
g.add_edge(START, "step")
g.add_conditional_edges("step", route)
app = g.compile()

app.invoke({"n": 0}, {"recursion_limit": 100})  # traced when the env vars are set
Four things that break the first run
| Symptom | Likely cause | Fix |
|---|---|---|
| Nothing appears | Old variable names (LANGCHAIN_TRACING_V2, LANGCHAIN_API_KEY) from older tutorials | Use the LANGSMITH_* names |
| Key rejected | Account is not in the default US region | Set LANGSMITH_ENDPOINT (EU example: https://eu.api.smith.langchain.com) |
| Wrong workspace | Key belongs to several workspaces | Set LANGSMITH_WORKSPACE_ID |
| Traces vanish in serverless | Function exits before the background upload finishes | Set LANGCHAIN_CALLBACKS_BACKGROUND=false (docs) |
Sending traces to an OpenTelemetry backend instead
If your company already runs an OpenTelemetry-compatible tool, LangChain tracing can feed it. Pydantic’s Logfire documentation shows three variables, set before you import langchain or langgraph (Logfire: LangChain):
python
import os
os.environ["LANGSMITH_OTEL_ENABLED"] = "true"
os.environ["LANGSMITH_OTEL_ONLY"] = "true"
os.environ["LANGSMITH_TRACING"] = "true"

import logfire
logfire.configure()
# import langchain / langgraph only after this point
I did not run this one, because it needs a Logfire project. The import-order warning is the detail most likely to cost you an hour.
What a trace is, and what you are billed for
A trace is the full record of one execution: a root run with everything nested under it.
text
assistant (root run)  = 1 trace
├── retriever      query, documents, latency
├── prompt         exactly what the model saw
├── chat model     tokens, latency
└── tool call      arguments, output, errors
For debugging, every node gives you inputs, outputs, latency, and token counts. When an answer is wrong, you can usually tell whether retrieval, the prompt, the model, or a tool was at fault.
For billing, the unit is the trace, not the step. LangChain’s pricing FAQ defines a trace as a single execution of your application, which can contain many steps such as model calls. A single trace can hold up to 25,000 runs (usage and billing docs).
I checked the client side of this. The 30-iteration graph above produced one root run and 61 runs in total on my capture server. Whether the server then bills it as one trace is LangChain’s side, but the docs and the ZenML guide both say a 40-step agent run is one trace. That makes LangSmith friendlier to deep agents than tools that meter every span. It does not make it cheaper overall, as the comparison below shows.
The 2026 price, and why sources disagree
Search “LangSmith pricing” and you will find four different trace prices on four pages that all claim to be current. The reason is simple: the price moved, and the guides did not.
What the official page says (2 November 2026)
| Item | Developer | Plus |
|---|---|---|
| Seat price | $0 (1 seat max) | $39 per seat per month, unlimited seats |
| Base traces included | 5,000 per month | 10,000 per month |
| Base retention | 14 days | 14 days |
| Extended retention | 180 days | 180 days |
| Unit of usage | 1 LSU = $1.00 | 1 LSU = $1.00 |
Source: LangChain pricing. Self-hosted and hybrid deployments are Enterprise only. LangChain also states that it does not train models on data you send to LangSmith.
The per-trace rate
LangChain’s page prices traces through an interactive calculator, and the static page text does not print the per-trace figure. The rate below therefore comes from two secondary sources that agree with each other and with the official LSU price:
- Base trace: 0.005 LSU, or $5.00 per 1,000 (ZenML, 23 September 2026; Flexprice).
- Upgrade to extended retention: 0.0025 LSU, or $2.50 per 1,000, added on top, so an extended trace costs $7.50 per 1,000 in total.
Why older guides show other numbers
| Period | What guides said | Where you still see it |
|---|---|---|
| Late 2025 | $0.50 per 1,000 base, $4.50 upgrade, 400-day extended | Flexprice’s price history |
| Early to mid 2026 | $2.50 per 1,000 base, $5.00 extended | Inference.net, June 2026 |
| From September 2026 | $5.00 per 1,000 base, 180-day extended for new traces | ZenML, Flexprice, the official FAQ (180 days) |
Two examples of stale or conflicting pages still ranking today: one 2026 guide lists 100,000 traces included on Plus at $0.50 per 1,000 (PE Collective), and another quotes $0.0005 per base trace with 400-day extended retention (TrueFoundry). Even LangChain’s own help pages disagree with themselves in places: the usage docs I retrieved still say 400 days, while the pricing page says 180.
A quick test for a stale pricing article: check whether it says 400-day retention, 100,000 included traces, or $0.50 per 1,000. Any of the three means it predates the current plan.
A cost calculator you can copy
This is my arithmetic from the published rates, not a LangSmith quote. It assumes one Plus seat, no discounts, and trace charges only. I ran it; the output below is what it printed.
python
SEAT = 39.00          # USD per seat per month
INCLUDED = 10_000     # base traces included per month on Plus
BASE = 0.005          # USD per additional base trace (0.005 LSU x $1)
UPGRADE = 0.0025      # USD per trace upgraded to extended retention

def monthly_cost(traces, seats=1, upgraded_share=0.0):
    base = max(0, traces - INCLUDED) * BASE
    upgrades = traces * upgraded_share * UPGRADE  # worst case: allowance does not offset upgrades
return seats * SEAT + base + upgrades| Traces per month | Base only | 10% upgraded | All upgraded |
|---|---|---|---|
| 10,000 | $39 | $42 | $64 |
| 50,000 | $239 | $252 | $364 |
| 100,000 | $489 | $514 | $739 |
| 500,000 | $2,489 | $2,614 | $3,739 |
| 1,000,000 | $4,989 | $5,239 | $7,489 |
Two cross-checks: ZenML’s published examples give $489 for 100,000 traces on one seat and $645 for five seats, and my function returns the same numbers.
The bill is not only traces
The trace line is the part you can control with sampling. Other LangSmith products are metered separately in LSUs on the official page:
- Engine (automatic failure analysis) runs on a schedule of once every six hours once enabled, and LangChain estimates roughly 7 to 45 LSUs per run. If every run executed for a 30-day month, that is 120 runs, or $840 to $5,400. That is my arithmetic from the published estimate, and it is an upper bound, but it shows why you should read the Engine settings before turning it on.
- Tuned Evaluators bill per successful evaluation (the Perceived Error evaluator is listed at 0.015 LSU per run).
- Deployment, Fleet, and Sandboxes each have their own meters.
The takeaway: on a small app the surprise is rarely the traces. It is the other meter you switched on.
The retention traps that inflate the bill
LangSmith invoices two trace metrics: a base charge for every trace sent, and extended-retention upgrades for traces kept longer (usage and billing). A trace can be upgraded after it arrives, so some of your cost is decided by features you turn on later.
According to LangChain’s docs and ZenML’s reading of them, these actions can upgrade a trace:
| Action | Extends retention? |
|---|---|
| Online evaluator scoring a trace, with its retention setting on | Yes, and new ones default to on |
| Automation rule that matches any run in the trace, with extension on | Yes, and new ones default to on |
Feedback sent through the API or SDK with extend_trace_retention=true | Yes, only if you ask for it |
| Experiment runs | Created at extended retention by default (ZenML) |
| Feedback or notes added in the UI; manual annotation-queue additions | No |
The practical rule: choose retention when you create a production project, then open every online evaluator and automation rule and look at what it does to retention. ZenML also notes that LangSmith’s usage calculator prices every extra trace at the base rate, so it leaves out upgrade costs. Treat the calculator as a floor.
One more fact worth knowing: LangChain lets you set monthly limits on total traces and on extended traces, and converts a spend limit into trace-count limits. ZenML warns that enforcement can overshoot slightly and that the limits do not cap your entire platform bill (view usage docs for where to find usage).
Sampling and conditional tracing, tested
Sampling decides how many traces you send. Conditional tracing decides whether a specific request is traced at all. They solve different problems.
bash
# keep roughly 25% of traces
export LANGSMITH_TRACING_SAMPLING_RATE=0.25
python
from langsmith import Client, tracing_context

half = Client(tracing_sampling_rate=0.5)
off  = Client(tracing_sampling_rate=0.0)

with tracing_context(client=half):
    agent.invoke(...)   # traced at about 50%

with tracing_context(enabled=False):
    agent.invoke(...)   # never traced, even if LANGSMITH_TRACING=true
What I measured
I ran a three-step chain against a local capture server and counted what the client sent. This tests the client’s behaviour only.
| Test | Result |
|---|---|
| One invocation of a 3-step chain | 1 root run, 4 runs total |
| Sampling rate 0.25 over 400 invocations | 107 traces kept (expected about 100, normal random spread is roughly ±9), 428 runs total |
| Sampling rate 0.0 | 0 traces |
enabled=False | 0 traces |
tags and metadata passed to tracing_context | Both present on the root run |
| 30-iteration LangGraph loop | 1 root run, 61 runs total |
Two lessons. First, sampling keeps or drops whole traces: 428 runs divided by 107 traces is exactly 4 runs per kept trace, so you never get half a trace. Second, random sampling is random: some of your failures will be in the dropped 75%.
Why probabilistic sampling should make you careful
Sampling is good for typical behaviour and cost control. It is a poor way to guarantee you see a specific bad case. For guarantees, use conditional tracing: always trace a tenant on a debug plan, never trace a tenant on a zero-retention contract, or route each customer’s traces to its own project. You can combine both.
The funnel that fools dashboards
Coverage shrinks at every stage. This is illustrative arithmetic:
| Stage | Count | Share of real executions |
|---|---|---|
| Application executions | 1,000,000 | 100% |
| 10% ingestion sample | 100,000 | 10% |
| Half pass the evaluator’s filter | 50,000 | 5% |
| 10% evaluator sample scored | 5,000 | 0.5% |
A dashboard reading “10% evaluated” would be wrong by a factor of 20. Put the denominator next to every quality percentage you report.
Production gotchas
Tag and attach metadata from day one. You cannot go back and attribute last month’s traces to a customer, a prompt version, or an experiment. Pick a small fixed set of keys, such as customer, environment, prompt version, and feature flag. I confirmed that tags and metadata passed to tracing_context land on the root run.
Decide what leaves your system before you switch tracing on. LangSmith has input and output masking, and LangChain says it does not train on your traces. Test masking with a sanitized trace, because an evaluator cannot judge content you removed from its inputs. If a contract forbids data leaving your cloud, the answer is self-hosting or hybrid, which the pricing page lists as Enterprise only.
Separate projects for dev, staging, and production. It keeps retention, sampling, and evaluators independent.
Serverless needs a flush. If the function exits before the upload, the trace is lost. Use LANGCHAIN_CALLBACKS_BACKGROUND=false as shown above.
Distributed tracing is supported. LangSmith links runs across services through context-propagation headers, so pass them if your agent calls your own microservices.
Do not copy a tutorial’s no-auth Docker setup into production. Public self-hosting demos exist for local development only.
LangSmith vs Langfuse vs OpenTelemetry
LangSmith is the shortest path if you are all-in on LangChain or LangGraph. It is not the only one, and the pricing models are not comparable at a glance because they count different things.
- LangSmith bills per trace, however many steps it contains, plus $39 per seat.
- Langfuse Cloud bills per unit, where a unit is a trace, an observation, or a score. Core is $29 a month with 100,000 units included, then $8 per 100,000, falling to $7, $6.50, and $6 at higher volume. It has unlimited users and offers free self-hosting under MIT (Langfuse pricing; tier breakdown from CostBench).
The conversion that matters is units per request. A 15-step agent can log about 20 units per request, according to BudgetForge’s worked example (source).
My arithmetic at list prices, one LangSmith seat versus Langfuse Core:
| Requests per month | LangSmith Plus | Langfuse Core, 5 units per request | Langfuse Core, 20 units per request |
|---|---|---|---|
| 50,000 | $239 | $41 | $101 |
| 100,000 | $489 | $61 | $171 |
| 500,000 | $2,489 | $206 | $731 |
| 1,000,000 | $4,989 | $381 | $1,381 |
This is list-price arithmetic only. It ignores seats on Langfuse (none), extended-retention upgrades on LangSmith, and the fact that Langfuse Core keeps data for 90 days while LangSmith’s base traces keep 14. It also ignores the cost of running a self-hosted instance and each product’s evaluation features. Read it as “the trace meter alone is not why most teams choose LangSmith,” not as a verdict.
A fair rule: choose LangSmith if you are on LangChain or LangGraph and want working traces fastest. Evaluate Langfuse or an OpenTelemetry backend if your stack is mixed, your volume is high, or your data-residency rules are strict. I found no neutral head-to-head benchmark of the tools, so I will not rank them.
Three teams that used tracing in production
All three accounts come from LangChain’s own blog or from sites summarising it, so read them as testimony, not independent measurement.
Clay (2026). Clay runs about 300 million agent runs a month, averaging 10 to 30 steps each. It built its own agent harness on the Vercel AI SDK, and connecting it to LangSmith took about one line of code, so tracing is on from day zero for every new agent. LangChain’s case study says tracked spend reconciles to provider bills at roughly 99.5%, and that 25 to 50 people have access, including some support staff (LangChain; ZenML summary). Copy this: give support a login, and attribute traces to customers early. Caveat: it is the only hard number in this set, and it is self-reported.
Mendable (2024). Mendable debugged its agent “Tools & Actions” feature with LangSmith, built evaluation datasets from production runs, and reports $1.3 million in savings for a large client over five months. ZenML flags that figure as self-reported and unverified (ZenML). Copy this: when a model writes the arguments your tool runs, inspect those arguments in the trace.
Elastic (2023 to 2024). For its security AI Assistant, Elastic used LangSmith to see exactly what reached the model while building ES|QL query generation, and later showed a LangSmith trace of the generation graph in its engineering blog (LangChain; Elastic). Copy this: when you add a capability to a prompt chain, trace the exact payload. Caveat: the claim that the assistant significantly cuts response time comes with no numbers, so I would not repeat it as fact.
The pattern: all three trace while building, not only after launch, and all three run multi-step flows. What is missing is independent evidence of how much time or money tracing saves.
From trace to fix: the loop that makes tracing pay
Traces alone are a dashboard. The value comes from what you do next:
- A complaint or alert arrives.
- You find the trace and read it step by step.
- You reproduce the failure and save it as a dataset example.
- You fix the prompt or code.
- You re-run your saved cases before deploying.
At Clay’s scale, the team says online evaluators become essential once manual review stops working, with runs in the hundreds of thousands or millions. Remember the retention trap from earlier: every online evaluator you add can extend trace retention and raise the bill.
Checklist you can paste into a ticket
LANGSMITH_TRACING,LANGSMITH_API_KEYandLANGSMITH_PROJECTset;LANGSMITH_ENDPOINTadded if you are outside the US region- Separate projects for dev, staging, and production
- Retention default chosen before production traffic starts
- Every online evaluator and automation rule checked for its retention effect
- A fixed set of tag and metadata keys decided (customer, environment, prompt version)
- Masking configured, and a sanitized trace reviewed
- Sampling rate chosen; conditional tracing set for traces that must always, or never, be sent
- Serverless flush handled
- Monthly estimate calculated with the script above, then checked against the live pricing page
- Engine, Tuned Evaluators, and other LSU meters reviewed before enabling
- Usage limits set for total traces and extended traces
- Support or operations given read access if they will investigate customer reports
- A named owner for trace expiry and dataset deletion
Frequently asked questions
How do I enable LangSmith tracing for LangChain? Set LANGSMITH_TRACING=true and LANGSMITH_API_KEY, optionally LANGSMITH_PROJECT, then run your chain or agent. No extra code is needed for LangChain or LangGraph.
Why are my traces not showing up? Check variable names (older tutorials use LANGCHAIN_*), your region endpoint, your workspace ID, and, in serverless, whether traces flush before the function exits.
How much does LangSmith cost per trace? On the current plan, an additional base trace is 0.005 LSU, which is $5 per 1,000, with 1 LSU equal to $1. Upgrading a trace to extended retention adds $2.50 per 1,000. Plus includes 10,000 base traces a month and costs $39 per seat. Confirm the rate on the live pricing page.
Does a 30-step agent run cost 30 traces? No. A trace is one execution with many steps, up to 25,000 runs. A 30-step run is one trace.
How long does LangSmith keep traces? Base traces are kept for 14 days. Extended traces keep 180 days on the official pricing page; some older documentation pages still say 400, so verify before you rely on it.
Is LangSmith free? The Developer plan is free for one seat with 5,000 base traces a month, and it is capped until you add a payment method.
Should I sample traces in production? If volume is high and you only need typical behaviour, yes. If you need guaranteed capture of specific cases, use conditional tracing instead of relying on random sampling.
Is LangSmith the only way to trace LangChain? No. LangChain tracing can export through OpenTelemetry, and Langfuse is a common alternative.
What I could not verify
- Server-side billing. I measured what the client sends, not what LangSmith bills. The one-trace-per-run claim rests on LangChain’s FAQ and the ZenML guide.
- The exact per-trace rate on LangChain’s own page. It sits inside an interactive calculator I could not render. The $5 figure matches two secondary sources and the official LSU price.
- Whether the 10,000 included traces offset extended-retention upgrades. My calculator assumes they do not, which is the worst case.
- Time or money saved by tracing. No independent before-and-after data exists in the cases I found.
- Head-to-head performance of alternatives. No neutral benchmark found.
- The OpenTelemetry route and the serverless flush setting. Both come from documentation and were not run here.
Appendix: reproduce the tests
Save the two files, install langsmith, langchain-core and langgraph, and run python t1.py. The server records only run-creation requests. Because it replaces LangSmith’s backend, it tells you about client behaviour, not billing.
python
# capture.py
import json, threading
from http.server import BaseHTTPRequestHandler, HTTPServer

RUNS = []

class H(BaseHTTPRequestHandler):
    def log_message(self, *a): pass
    def _ok(self):
        self.send_response(200)
        self.send_header("Content-Type", "application/json")
        self.end_headers()
        self.wfile.write(b"{}")
    def do_POST(self):
        body = self.rfile.read(int(self.headers.get("Content-Length", 0)))
        if self.path.rstrip("/").endswith("/runs"):
            try: RUNS.append(json.loads(body))
            except Exception: pass
        self._ok()
    def do_PATCH(self):
        self.rfile.read(int(self.headers.get("Content-Length", 0)))
        self._ok()
    def do_GET(self): self._ok()

def start(port=8765):
    s = HTTPServer(("127.0.0.1", port), H)
    threading.Thread(target=s.serve_forever, daemon=True).start()
    return s
python
# t1.py
import os, time
os.environ["LANGSMITH_TRACING"] = "true"
os.environ["LANGSMITH_API_KEY"] = "test"
import capture; capture.start()
from langsmith import Client, tracing_context
from langchain_core.runnables import RunnableLambda

def client(**kw):
    return Client(api_url="http://127.0.0.1:8765", api_key="x",
                  auto_batch_tracing=False, **kw)

chain = (RunnableLambda(lambda q: ["doc1", "doc2"], name="retriever")
         | RunnableLambda(lambda x: f"ctx={x}", name="prompt")
         | RunnableLambda(lambda p: "answer", name="chat_model"))

roots = lambda: [r for r in capture.RUNS if not r.get("parent_run_id")]

c = client(tracing_sampling_rate=0.25)
with tracing_context(client=c, enabled=True):
    for _ in range(400):
        chain.invoke("q")
c.flush(); time.sleep(0.5)
print("traces kept:", len(roots()), "| total runs:", len(capture.RUNS))
Sources
Official
- LangChain pricing (fetched 2 November 2026)
- LangSmith usage and billing
- LangSmith: view usage
- Trace LangGraph applications
- LangSmith observability quickstart
Pricing analysis
- ZenML: LangSmith pricing guide (23 September 2026; vendor of a competing tool)
- Flexprice: LangSmith price history
- Inference.net: LangSmith pricing, June 2026
- Langfuse pricing, CostBench: Langfuse, BudgetForge: Langfuse units
Case studies
- LangChain: How Clay uses LangSmith, ZenML: Clay
- ZenML: Mendable
- LangChain: Elastic AI Assistant, Elastic engineering blog
Other
Pricing, retention windows, and defaults change often. Last checked against sources on 2 November 2026. If you spot a number that has moved, tell us, and we will update this page.